There's an energy crisis in Europe. Just two years ago, prices in Sweden were about €0.03 per kWh, now they regularly reach over €0.5/kWh during the mornings and afternoons. So - we all need to save electricity. That's not easy though, if you don't know what your big consumers are.
Some modern electricity meters have a digital interface called a Han port that lets you read energy consumption in real time. Mine is too old for that. But it does have a blinking led... that blinks once for every Wh consumed. You can buy a special optical reader to track those blinks - but what would be the fun in that when you can build your own.
What you need:
- Raspberry Pi (any model will do, I used a 2 B+)
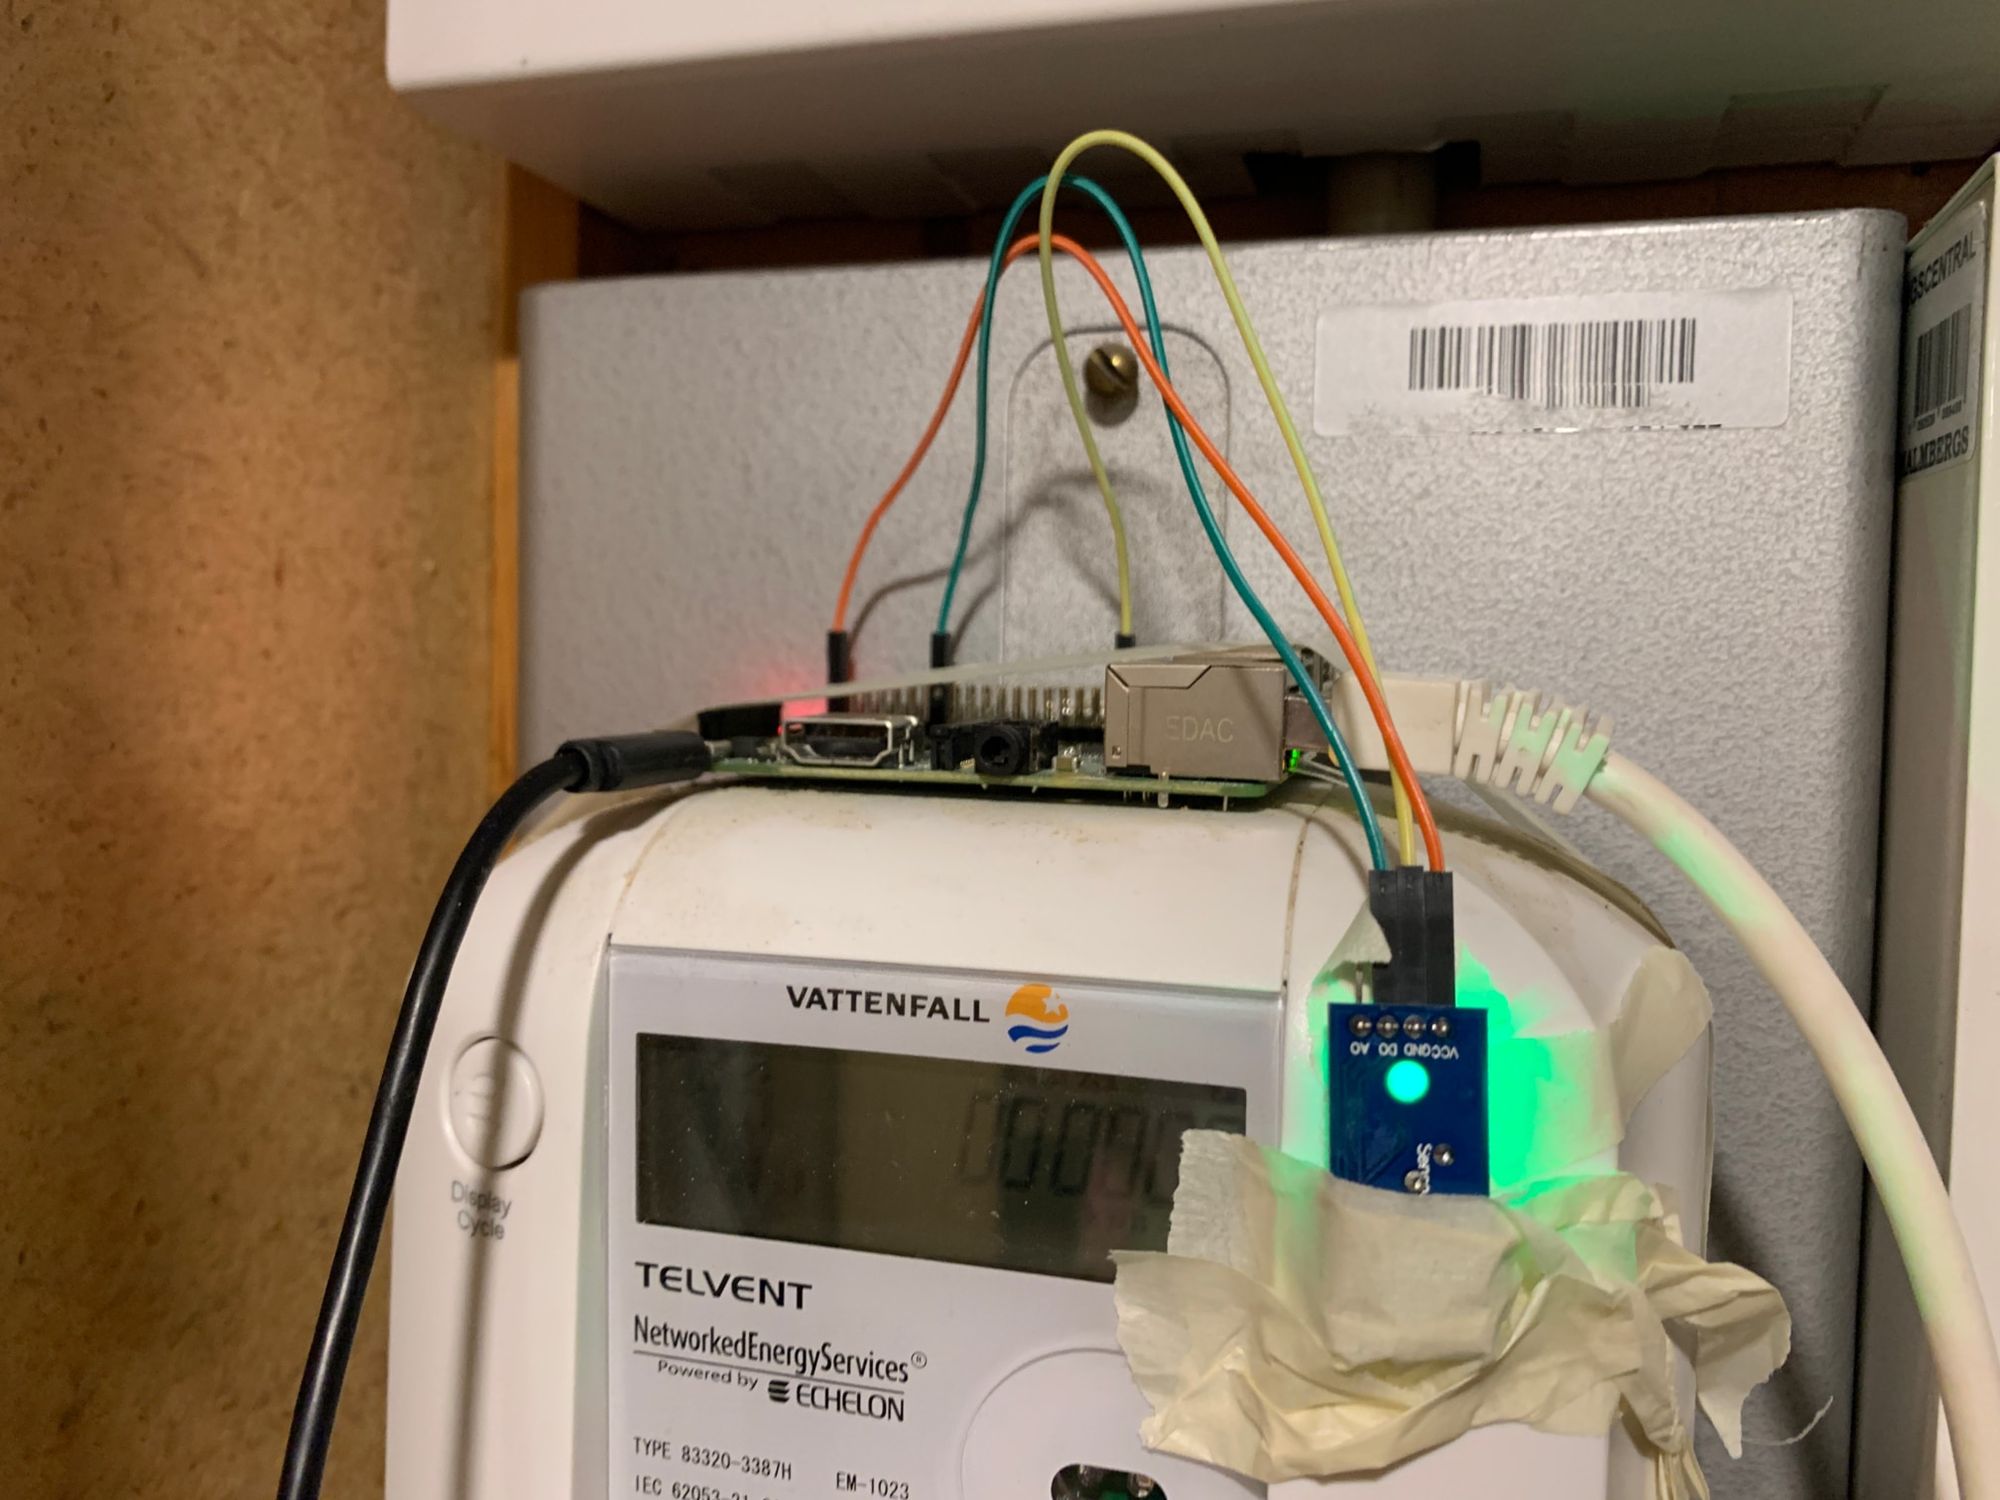
- A photoresistor. I chose to go for this fancier component (that was just €5) that has the photoresistor but also a potentiometer so set sensitivity (for digital mode) and indicator leds showing if it's powered and (more importantly) if light is detected. Super helpful when you are troubleshooting and trying to place the resistor correctly over the led.
Hardware assembly
The light sensor PCB I bought has four connectors:
- Power - 3V-5V
- Ground
- DO - digital out
- AO - analog out
I decided to use DO since I'm only going to detect pulses from the electricity meter led - I only care about on or off, not the led intensity.
On my Raspberry 2 I connected:
- PCB power pin to Raspberry pin 1 (3.3V)
- PCB ground to Raspberry pin 39 (GND)
- PCB DO to Raspberry pin 15 (GPIO22).
The numbering of the pins on the Raspberry and their names are quite confusing. So look up a diagram of the pins on the Raspberry model you're using so you don't accidentally fry you PCB.
Switching the Pi on lit the power led on the PCB, and then I could move my hand in front of the photo resistor to see the indicator led on the PCB go on and off. So far everything seemed to be working as expected!
Finally I mounted my beautiful contraption on the electricity meter using masking tape:
On-board Software
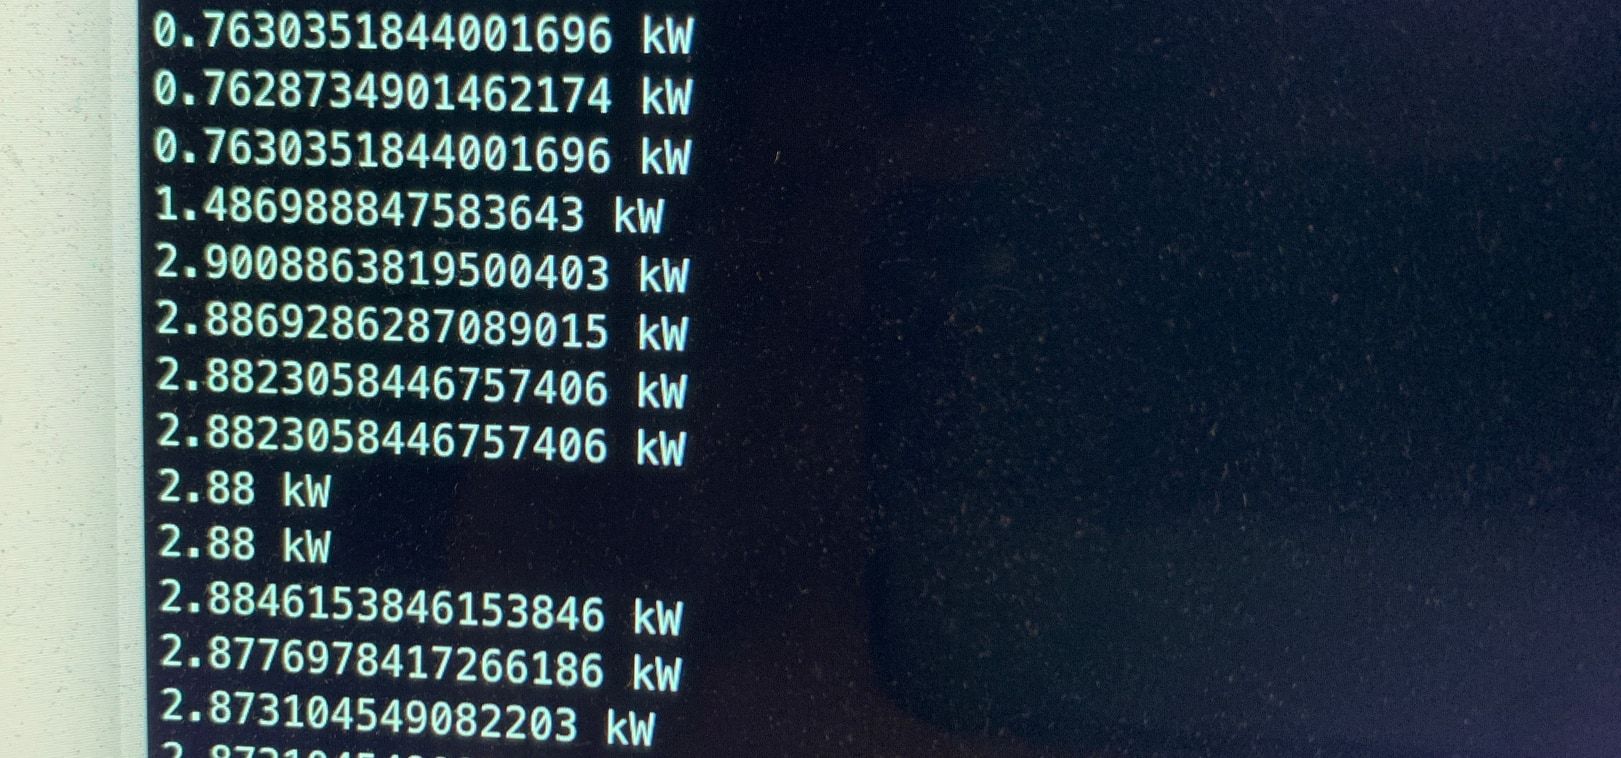
I decided to make the on-board application as small as possible. I made a small Node.js script (github repo is linked below) that uses the rpio npm package to poll GPIO22. Every time GPIO22 goes high, that means the photo resistor has detected light. Since it's 1000 blinks for 1 kWh, you can get the current electricity consumption by just comparing the time between the current led blink and the last one (3600/(now - last) kW, where now and last are datetime milliseconds).
With the careful positioning of the photo resistor as shown above, I could see this output in the console. You can clearly see the time I turned on the electric kettle as a test.
Visualization and Analysis
You don't want to sit around watching a console though, so I decided to add some visualization software. I installed InfluxDB, a database specially made for storing time-based series of data. I added a few lines to my node script on the raspberry, so every time the led blinked it now sends the current consumption to Influx. The interesting part is that since the time of the reading itself contains the information about consumption (it's 1 wH per blink), you can do calculations and visualizations both based on the consumption value and the point in time.
I made a dashboard showing both the current consumption, but also a chart showing consumption over time and hour for hour (since that's how it's going to be charged).
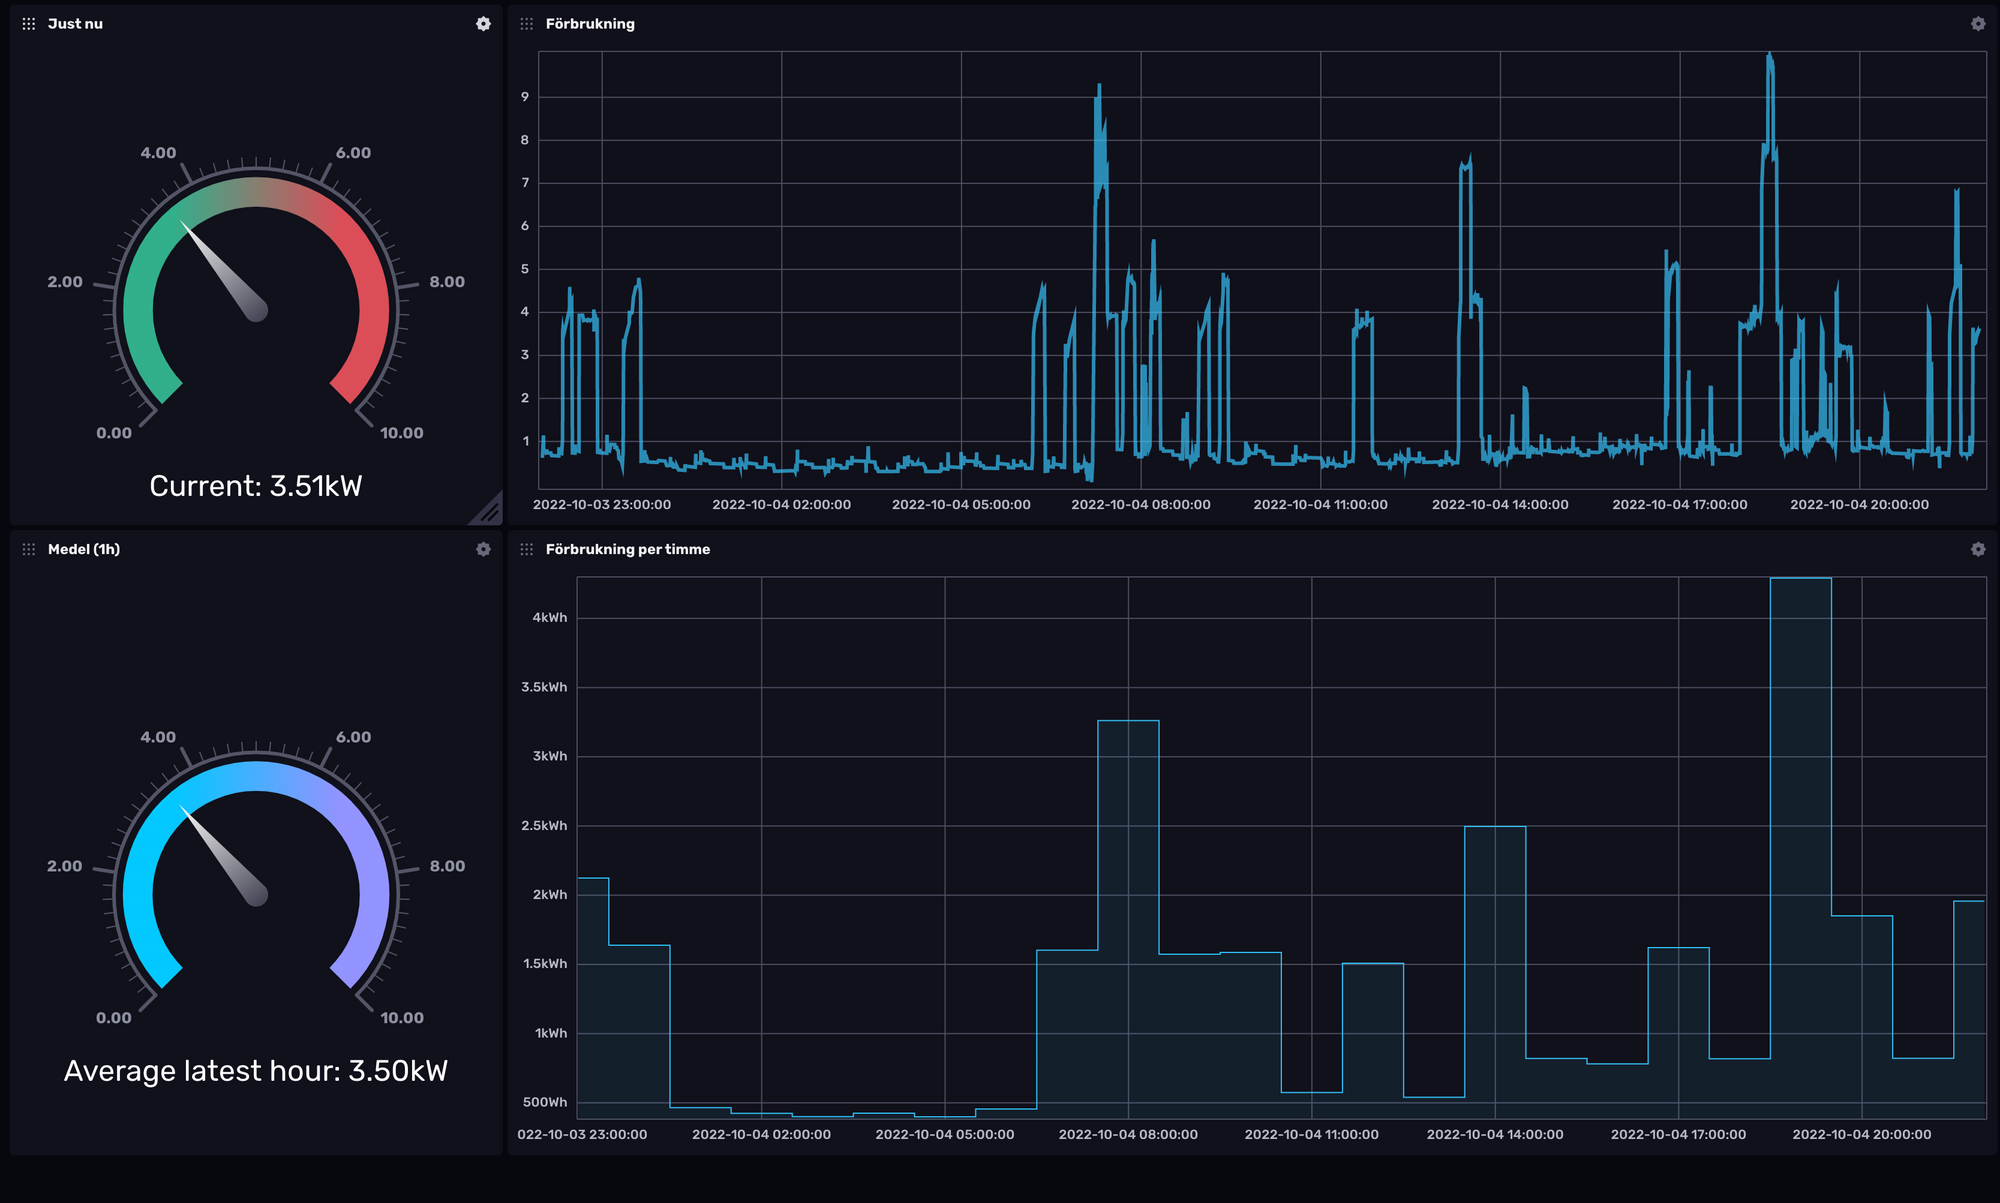
I immediately saw that my heating pump would run at exactly the hours I set it not to run. It would spike during mornings and afternoons and basically not run at all during the night. I later could confirm that it has the most stupid UI I've ever run across - if you activate "scheduled lower night temperature" you input the intervals where you want normal temperature, not the ones where you want lowered temperatures. Glad to have found that out before the actual cold gets here.
Code and Additional Resources
Here's the code for the node application on the Raspberry. It is extremely simple and has no error handling or any helpful extras at this point. There is an influx dashboard example in the resources directory.
 osirisguitar
To make the rpio reading behave properly on older Raspberrys you need to put this in /boot/config.txt and reboot it.
dtoverlay=gpio-no-irq
To keep the app running on the Raspberry, use the linux command screen (install it with apt install screen):
- Run screen:
:>screen - Run
:>node index.js - Press CTRL-A and then d to detach from the screen.
If you want to go back to the screen later, do screen -ls to find its id and then screen -r id.
Good luck with your electricity savings!